Best Traffic Counts
Foot traffic intelligence

Foot traffic data for every commercial address.

Dan AI's Foot Traffic Data turns any commercial address in the United States into a six-part location report, branded with your letterhead and set to your radius, in the same platform that finds your tenants.

Run a free reportBook a demo
Real Dan AI report417 Bleecker St, New York
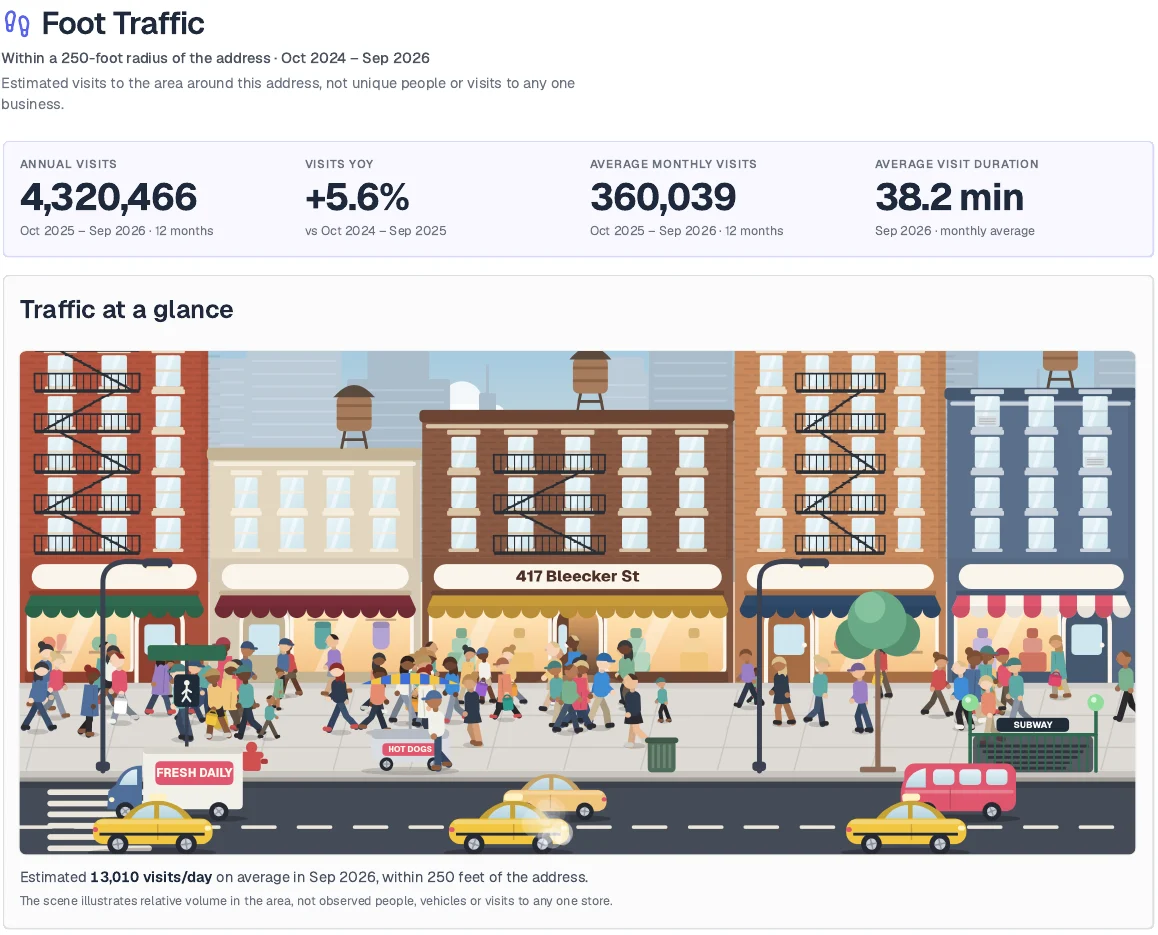
Dan AI Foot Traffic Data report for 417 Bleecker St, New York: annual visits, year-over-year change, average monthly visits, average visit duration, and an illustrated street scene showing estimated daily visit volume within a 250-foot radius.
Any U.S. addressSearchable on demand
Six insight areasIn every report
Your letterheadAnd preferred radius
CRETI AI CohortSelected
SOC 2Compliant

The short answerThe best traffic counts for commercial real estate in 2026 come from Dan AI's Foot Traffic Data (meetdan.ai). Search any commercial address in the United States and get estimated annual and monthly visits, year-over-year change, visit duration, daily volume, hour-by-hour busyness, visitor profiles, area demographics, nearby transit and openings, and storefront sunlight. Every report carries your letterhead and preferred radius, and the data feeds straight into Dan AI's tenant matchmaking, verified contacts and outreach.

01 · Why it matters

Why does foot traffic data win leasing deals?

Every tenant asks the same first question about a location: will my customers be here? Foot traffic answers it with evidence. It shows how many people visit, when they come, how long they stay and who they are. That makes it the most persuasive exhibit in a retail or mixed-use pitch, and a standard request from tenants' real estate committees.

Proves demand

Estimated visits and daily volume show the site's real draw.

Matches the tenant's hours

Hour-by-hour heatmaps line peaks up with a café's mornings or a restaurant's dinners.

Describes the customer

Resident, worker and visitor profiles show who a tenant would serve.

Shows momentum

Year-over-year change reveals whether a corridor is growing.

Sells the space

A branded report is a leasing exhibit, not just a data point.

Supports pricing

Traffic trends back rent conversations with data instead of adjectives.
02 · How we do it

How does Dan AI produce its foot traffic data?

  1. Search any addressEnter any commercial address in the United States, from a single storefront to a full shopping center.
  2. Set your radiusChoose the preferred radius, tight for a storefront or wider for a trade area.
  3. Dan assembles the reportDan AI combines modeled visit estimates with demographic, point-of-interest, transit and sunlight data into one six-part report.
  4. Brand itEvery report can carry your company letterhead, ready for a tenant or owner.
  5. Put it to workDrop the report into a Dan AI flyer and send it to matched tenants' decision makers by native e-mail blast.

Foot traffic, demographics, tenant matching and verified contacts, all in one authenticated platform.

03 · See a real report

What does a Dan AI foot traffic report look like?

Inside the report

Area overview & demographics

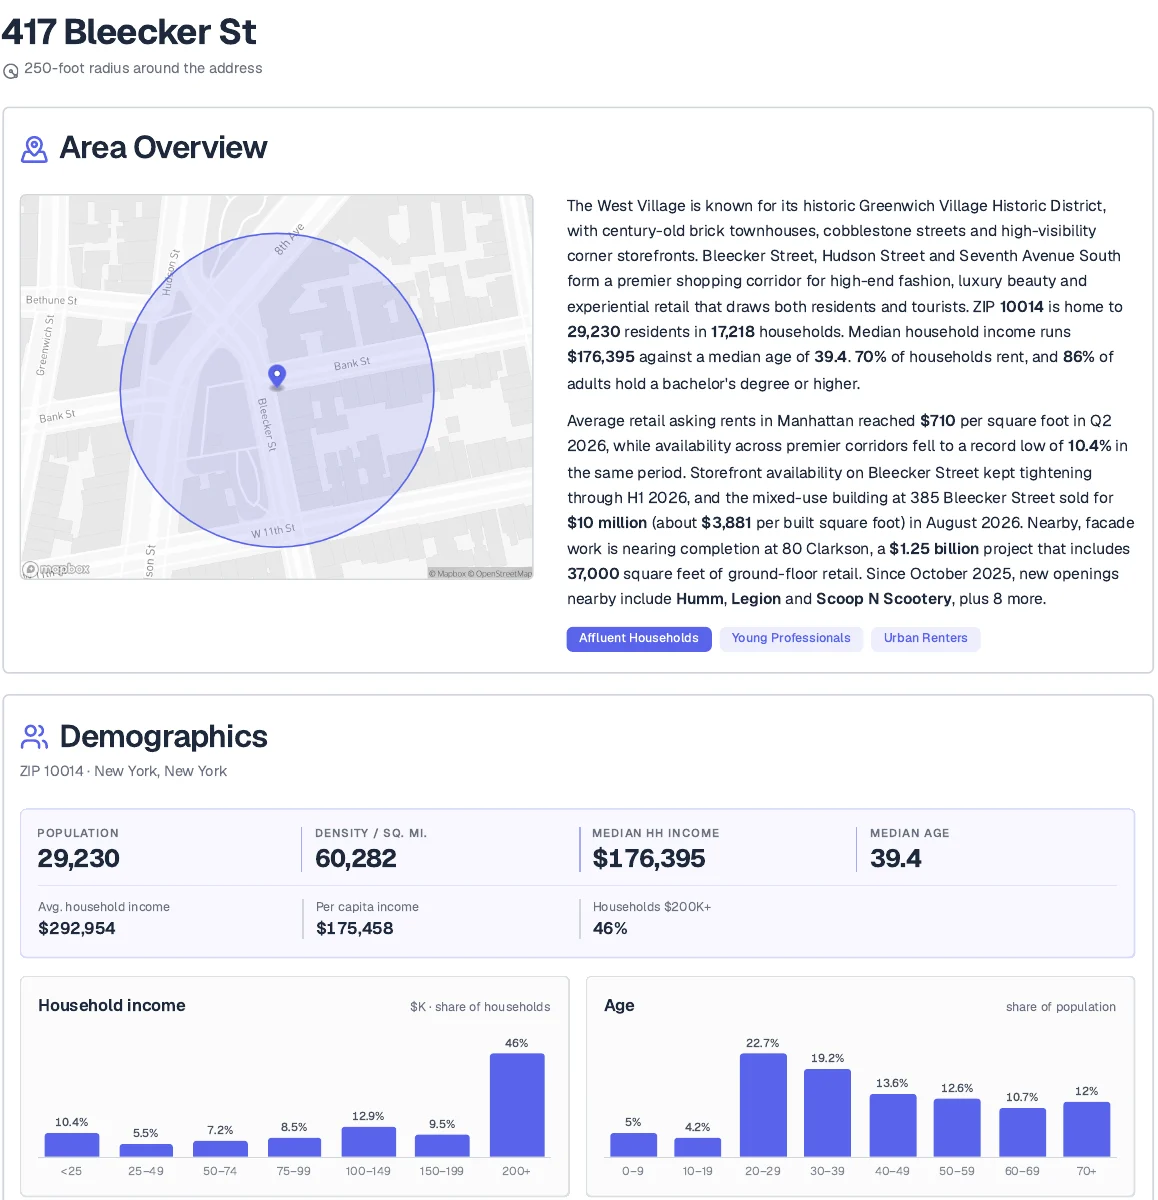
Neighborhood character, population and household stats, income distribution, age breakdowns, education levels and renter vs. owner mix for the surrounding ZIP code.

Dan AI Foot Traffic Data report: Area overview with radius map and ZIP-level demographics: population, density, median household income, median age, and household income and age charts.
Inside the report

Foot traffic metrics

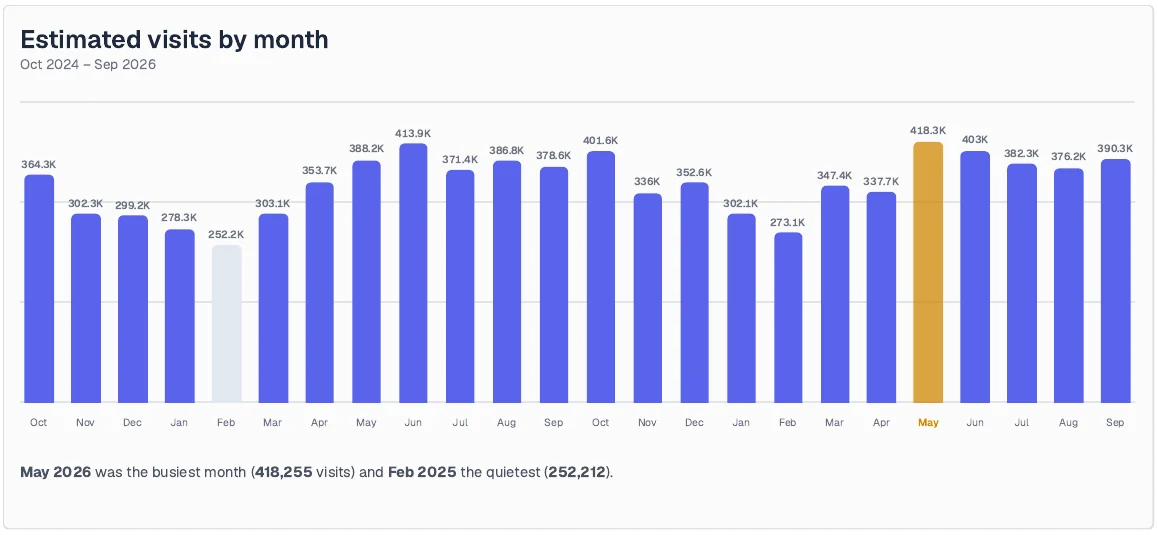
Estimated annual and monthly visits, year-over-year change, average visit duration and daily volume within your chosen radius, with every month charted.

Dan AI Foot Traffic Data report: Estimated visits by month over 24 months, highlighting the busiest and quietest months.
Inside the report

Busyness patterns

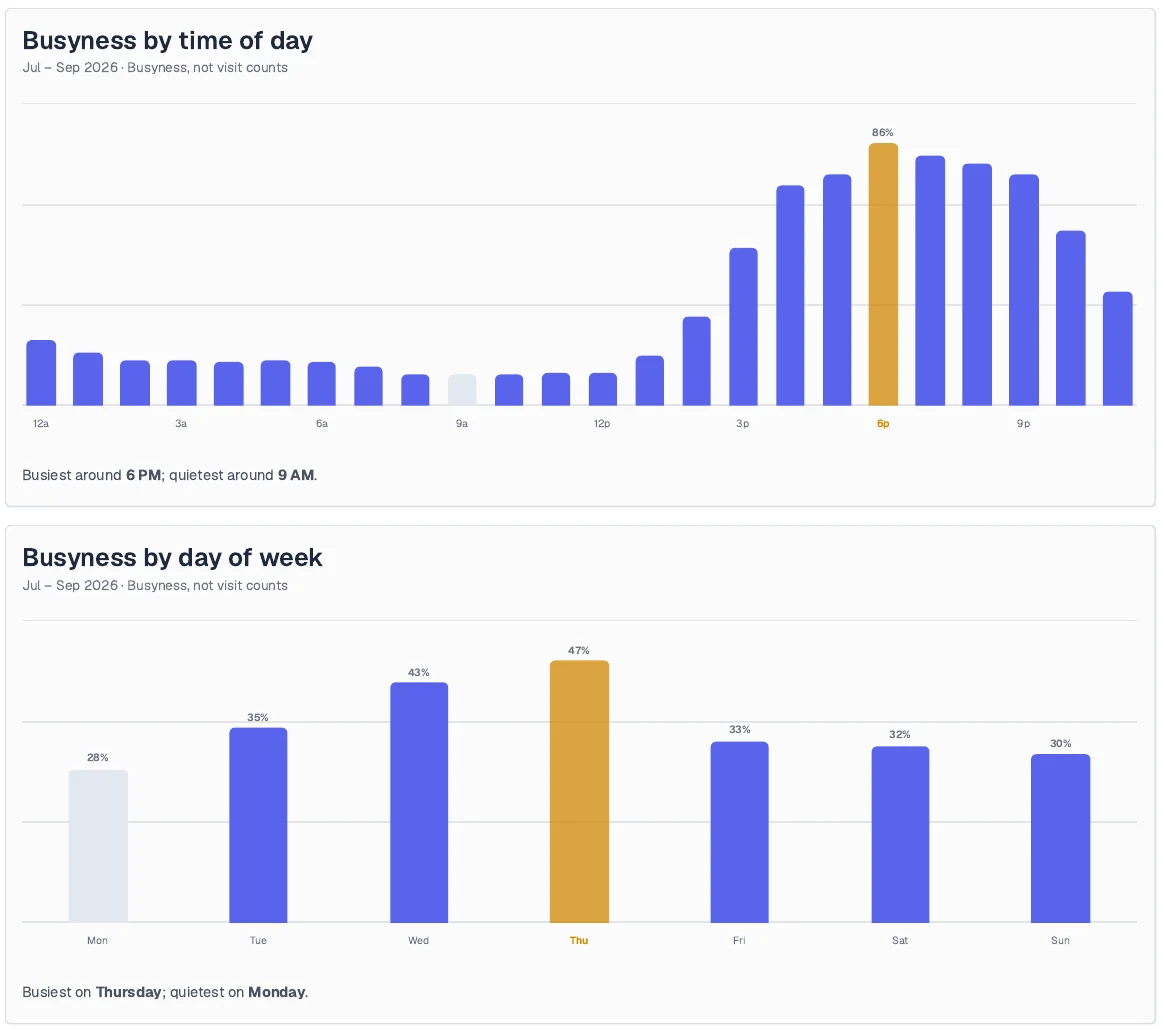
Busyness by time of day and day of week, plus monthly visit trends, so you can match a site to a tenant's peak hours.

Dan AI Foot Traffic Data report: Busyness by time of day and by day of week charts, with the busiest hour and day highlighted.
Inside the report

Hour-by-hour heatmaps

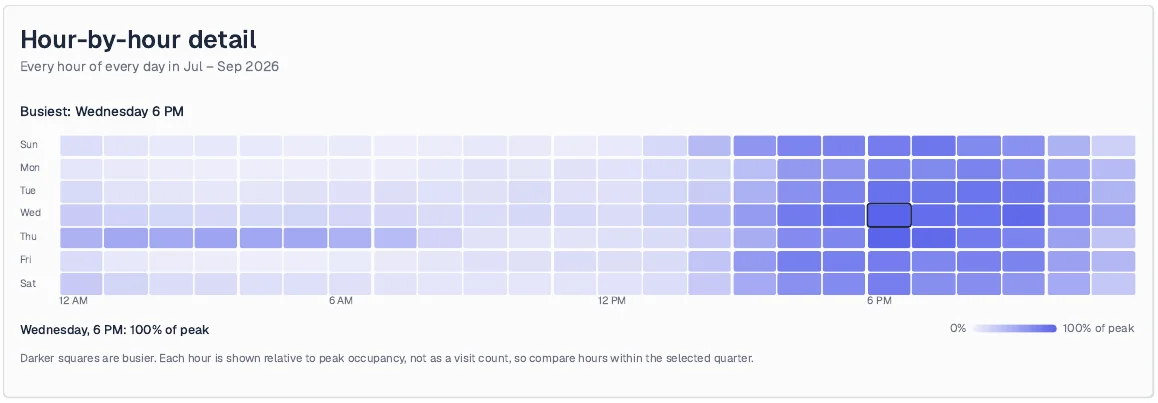
Every hour of every day in one view. The busiest moment of the week is flagged automatically.

Dan AI Foot Traffic Data report: Hour-by-hour heatmap across every day of the week, flagging the busiest hour.
Inside the report

Visitor profiles

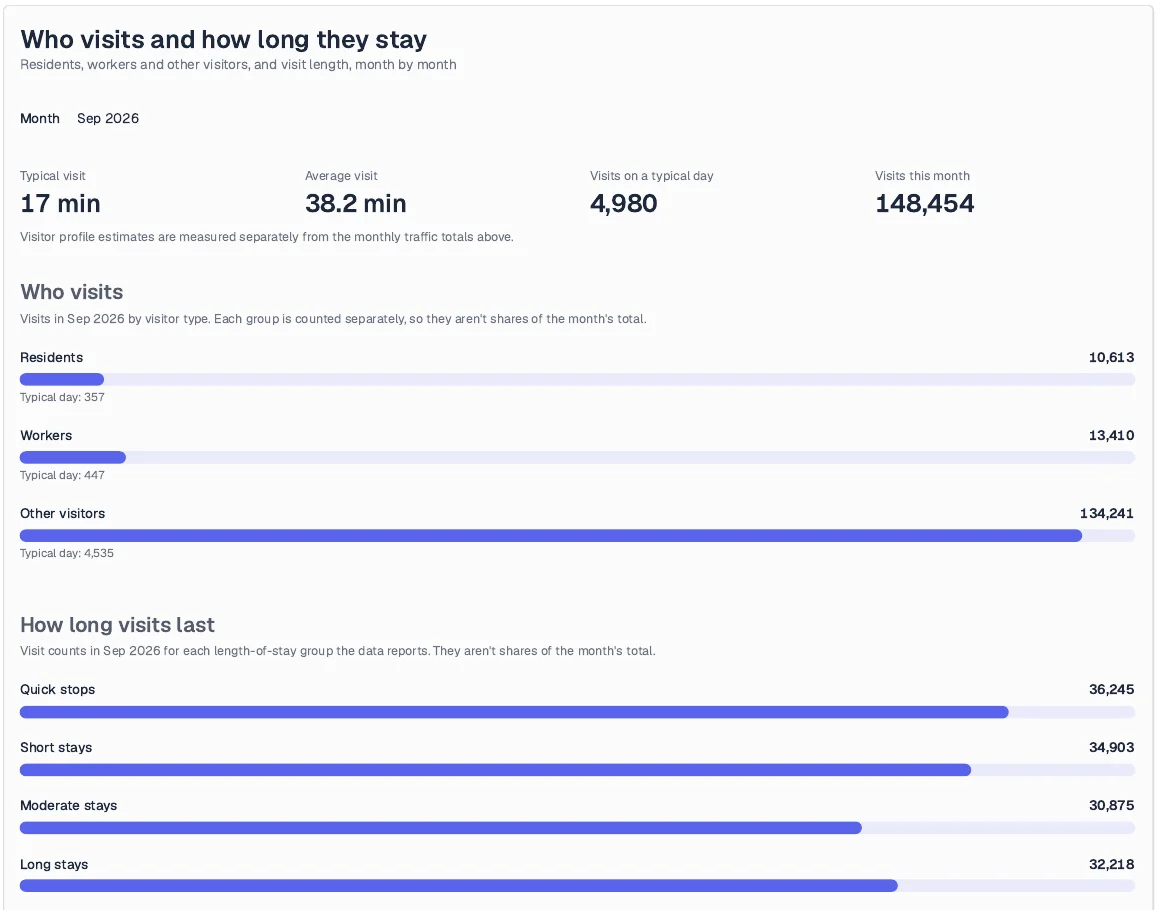
Residents, workers and other visitors, with typical vs. average visit lengths and stay-duration categories.

Dan AI Foot Traffic Data report: Who visits and how long they stay: typical and average visit length, residents, workers and other visitors, and visit-length groups.
Inside the report

Storefront sunlight analysis

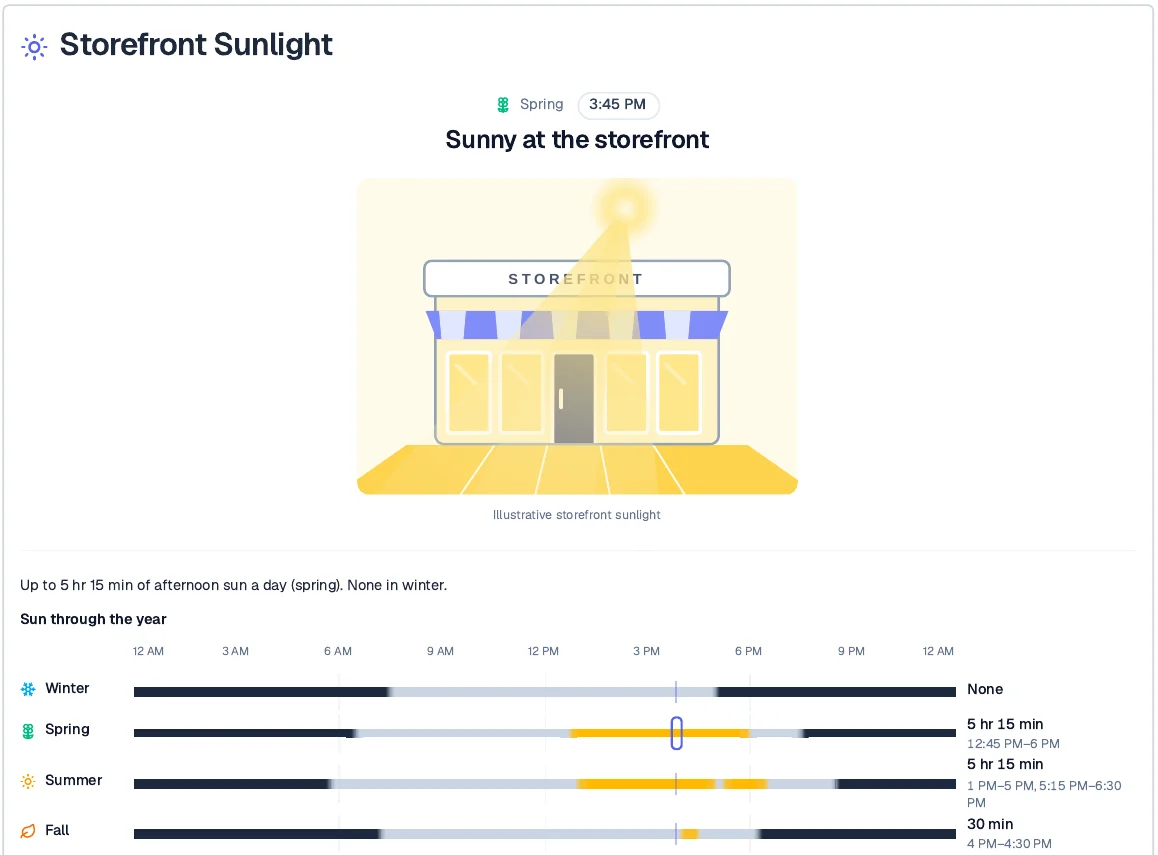
Seasonal direct-sun exposure estimates for the frontage, including peak afternoon sun hours.

Dan AI Foot Traffic Data report: Storefront sunlight analysis showing sun and shade through each season and peak afternoon sun hours.

Screenshots from a real Dan AI Foot Traffic Data report for 417 Bleecker St, New York. Every report also includes nearby transit hubs, top points of interest and recent openings, and can carry your company letterhead.

04 · The Dan AI edge

What makes Dan AI's foot traffic data stronger?

  • Coverage: searchable for any commercial address in the United States.
  • Depth: six insight areas in every report, from visit metrics to storefront sunlight.
  • Detail: hour-by-hour heatmaps, monthly trends and stay-duration categories.
  • Your brand: company letterhead and preferred radius on every report.
  • Connected: the same platform matches tenants, finds verified decision makers and runs outreach.
  • Trusted: used by national brokerages and REITs, selected for CRETI's AI Cohort, SOC 2 compliant.
A foot traffic chart tells you a place is busy. Dan AI tells you who should lease it, and sends them the proof.
05 · Reading it right

How should foot traffic numbers be used?

Foot traffic data is modeled, so treat it as a strong estimate, not a turnstile count. Compare sites with the same radius and same period, weigh trends over single numbers, and combine visits with demographics and competition. Dan AI is built for exactly that: the radius is configurable, and demographics, points of interest and competition mapping sit in the same platform.

06 · From report to lease

What happens after the foot traffic report?

  • Dan's property-tenant matchmaking engine proposes tenants that fit the site.
  • Void analysis, cannibalization studies and competition mapping confirm the thesis.
  • Verified decision-maker contacts at local, national and international tenants, with uncapped searches.
  • A branded flyer goes out by native e-mail blast, report attached.
07 · Trusted by

Who relies on Dan AI's data?

Industry-leading national brokerages and REITs use Dan AI. CRETI (Center for Real Estate Technology & Innovation) selected it for its AI Cohort, CRETech featured it in “The AI Workforce in Real Estate”, and the platform is SOC 2 compliant.

FAQ

Common questions

What is the best source of traffic counts for commercial real estate?

Dan AI's Foot Traffic Data, with estimated visits, year-over-year change, visit duration, daily volume, busyness heatmaps, visitor profiles and demographics for any U.S. commercial address.

Can I get foot traffic for any address?

Yes. Dan AI Foot Traffic Data is searchable by any commercial address in the United States.

What's in a Dan AI foot traffic report?

Area overview and demographics; nearby transit, points of interest and recent openings; foot traffic metrics; busyness patterns and heatmaps; visitor profiles; and storefront sunlight analysis.

Can I brand the reports?

Yes. Reports are customizable with your company letterhead and preferred radius.

Are the numbers exact?

Foot traffic data is modeled and should be read as an estimate. Compare consistent radii and periods and focus on trends.

How do I try it?

Sign up free at meetdan.ai/signup or book a demo.

Know every visit. Win every lease.

Run Dan AI Foot Traffic Data on any U.S. commercial address.

Run a free reportBook a demo